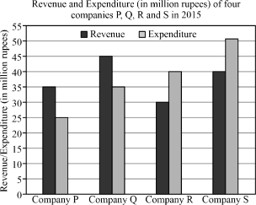
5. Data InterpretationMedium
The revenue and expenditure of four different companies P. Q. R and S in 2015 are shown in the figure. If the revenue of company Q in 2015 was 20% more than that in 2014, and company Q had earned a profit of 10% on expenditure in 2014. then its expenditure (in million rupees) in 2014 was.