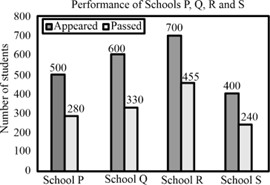
The bar graph shows the data of the students who appeared and passed in an examination for four schools P, Q, R and S. The average of success rates (in percentage) of these four schools is.